Spring 2018
Time: 12:30-1:45pm MW
MW Room: DHHC 215
INSTRUCTOR: Dr. Adam Sundberg
OFFICE: DH 220
OFFICE HOURS: 2pm – 4pm MW and by appointment
EMAIL: adamsundberg@creighton.edu
REQUIRED TEXTS/ TOOLS
Recommended purchase: Cynthia Brewer, Designed Maps: A Sourcebook for GIS Users (ESRI Press, 2008)
COURSE TOPICS:
This course is divided into four parts.
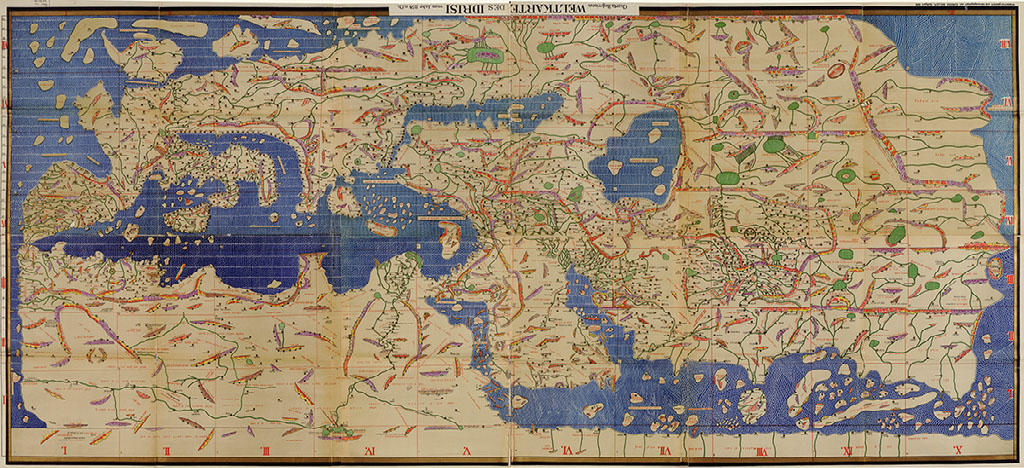
- Part One (Mapping, Environments, and History) An introduction to the key terminology and themes in the history of cartography including: the mapping impulse, visualizing change across space and time, and the global diversity of mapped environments.
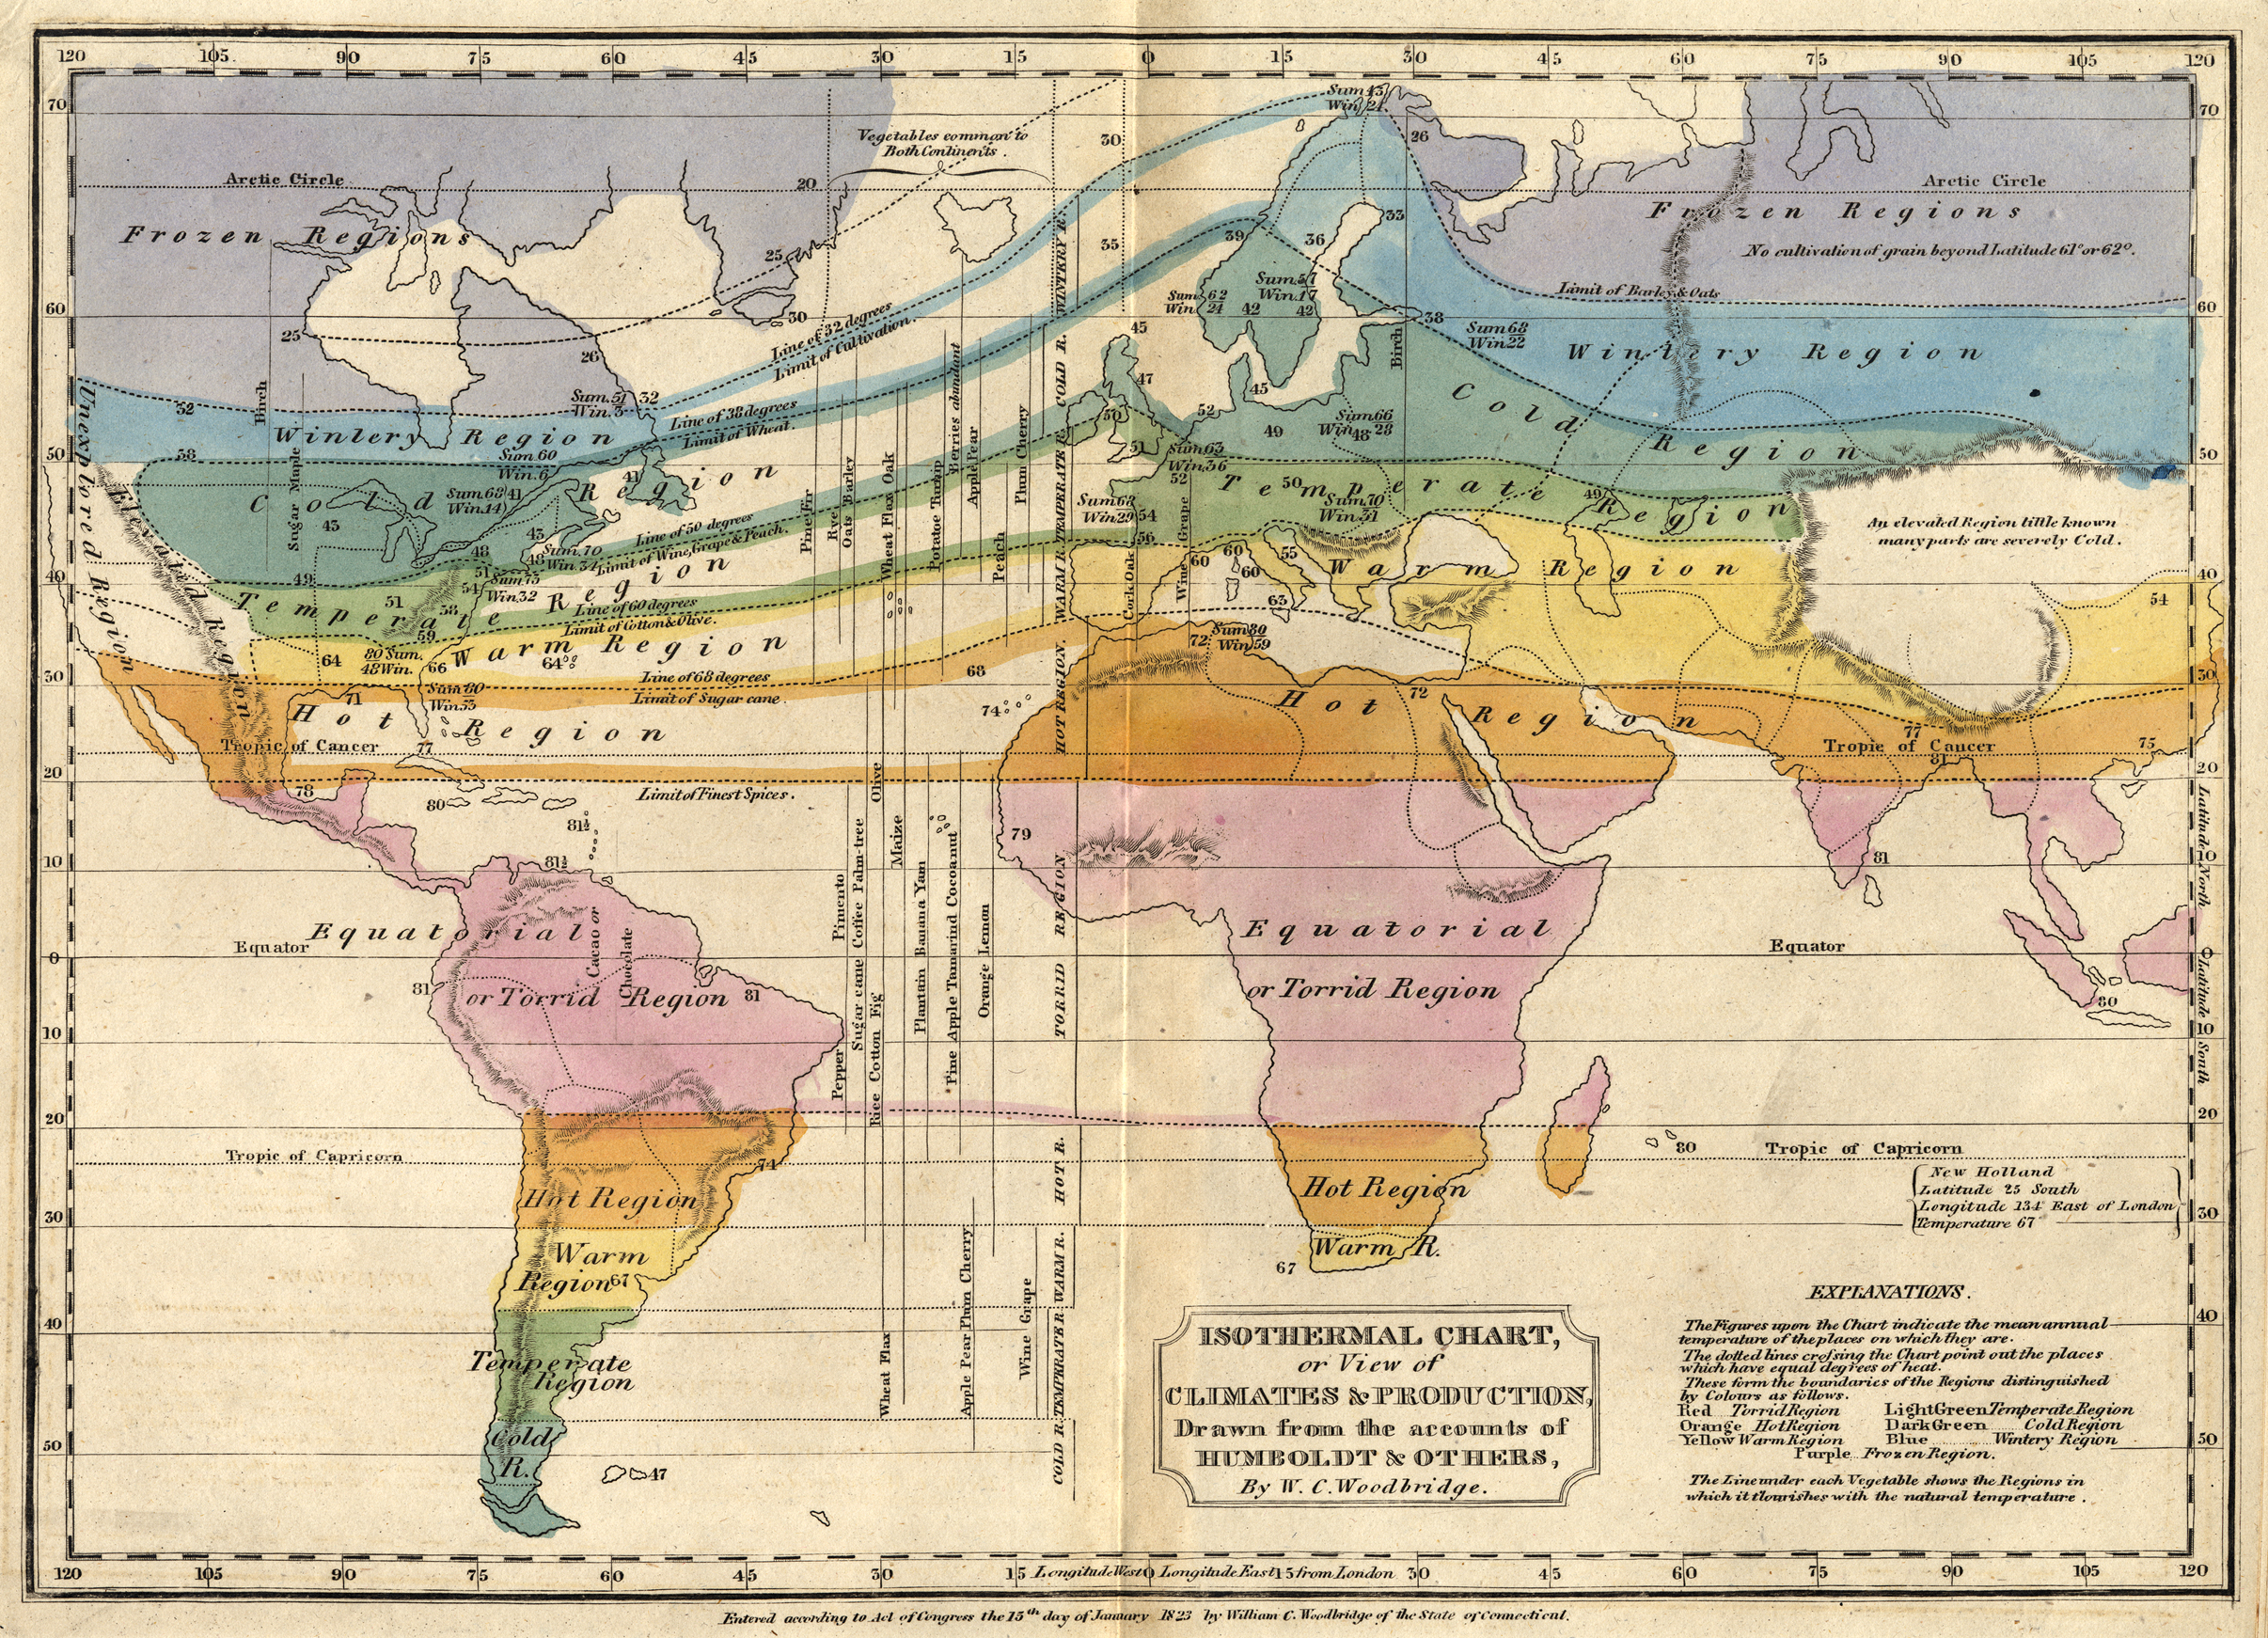
- Part Two (Mapping Invisible Environments) focuses on thematic mapping, the rise of statistics, and the use of maps to make arguments about the natural world. -
- Part Three (Mapping Disaster Environments) builds on lessons from previous course sections to evaluate the various ways maps can chart the causes and consequences of nature-induced disasters.
- Part Four (Mapping the Lived Environment) expands the scope of our analysis to consider the methods and consequences of mapping the earth on global and local scales in the 21st century and considers the democratization and implications of surveillance culture.
Core & Mission Fit
Mapping is an art, a science, and a cultural practice. This course not only surveys the history of cartography from the fifteenth century to the present, but also challenges students to integrate the lessons of historical mapping and analysis into original mapping products using geospatial software. It introduces students to the broad themes in the production, meaning, and implications of mapping and applies them to the history of humanity’s relationship with the environment. How does mapping represent, shape, or distort our surroundings? What role has cartography played in defining and controlling people and environments and how have these themes changed across time? How has the widespread availability of digital mapping applications challenged or reinforced these historic trends? Issues of data reliability, privacy and security (of the individual and the state), and equity are explicitly addressed in these questions and each have been central themes in the history of cartography since the early modern period. They will also create and critique their own digital maps using geographic information systems. Students will thus participate in the map-making tradition, informed by technical skills gained in the course as well as the capacity to critically engage their historical and ethical implications.
Core Learning Outcomes
Students will use technology effectively for research, analysis, communication, and collaborative work.
Students will recognize that technology and the digitization of knowledge are powerful tools and will identify potential dangers concerning reliability, privacy, security, and equity
Part I. Mapping, Environments, and History
Week 1 – Mapping as Geography
Wed (Jan 10)
Syllabus - Introduction
Week 2 - Mapping History as Geography-
Mon (Jan 15) - Mapping History as Geography
Wed (Jan 17) - Storymapping
Post story mapping assignment to blog
Week 3 – Maps as Metaphor
Mon (Jan 22)
Blog Due - Email Dr. Sundberg url from DavidRumsey of your Gigapixel Map
Wed (Jan 24)
Part II. Mapping Invisible Environments
Week 4 – Mapping the Geophysical World
Mon (Jan 29)
Blog Due
Wed (Jan 31)
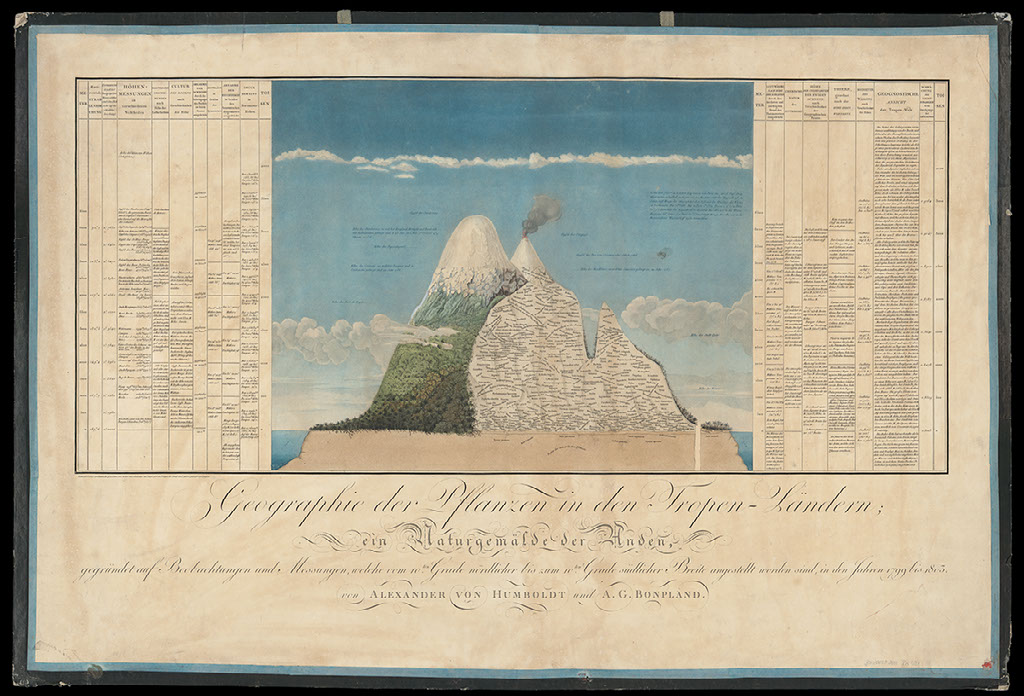
Week 5 – Mapping Climate and Colonialism
Mon (Feb 5)
Blog Due
Wed (Feb 7)
Week 6 – Mapping Human Inequality
Mon (Feb 12)
Blog Due
Wed (Feb 14)
Week 7 – Mapping Rural Development
Mon (Feb 19)
Blog Due
Wed (Feb 21)
Part III. - Mapping Disaster Environments
Week 8 – Disease Environments
Mon (Feb 26)
Blog Due
Wed (Feb 28)
Mar 5-11 – NO CLASS - SPRING BREAK
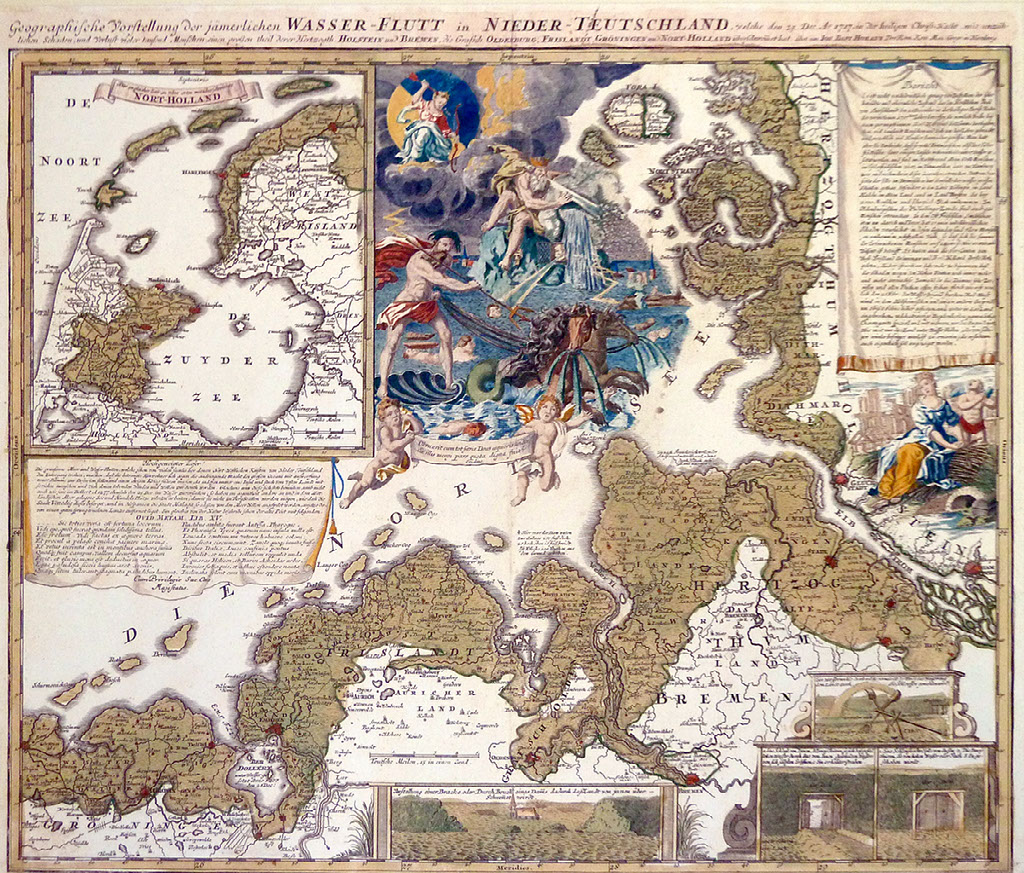
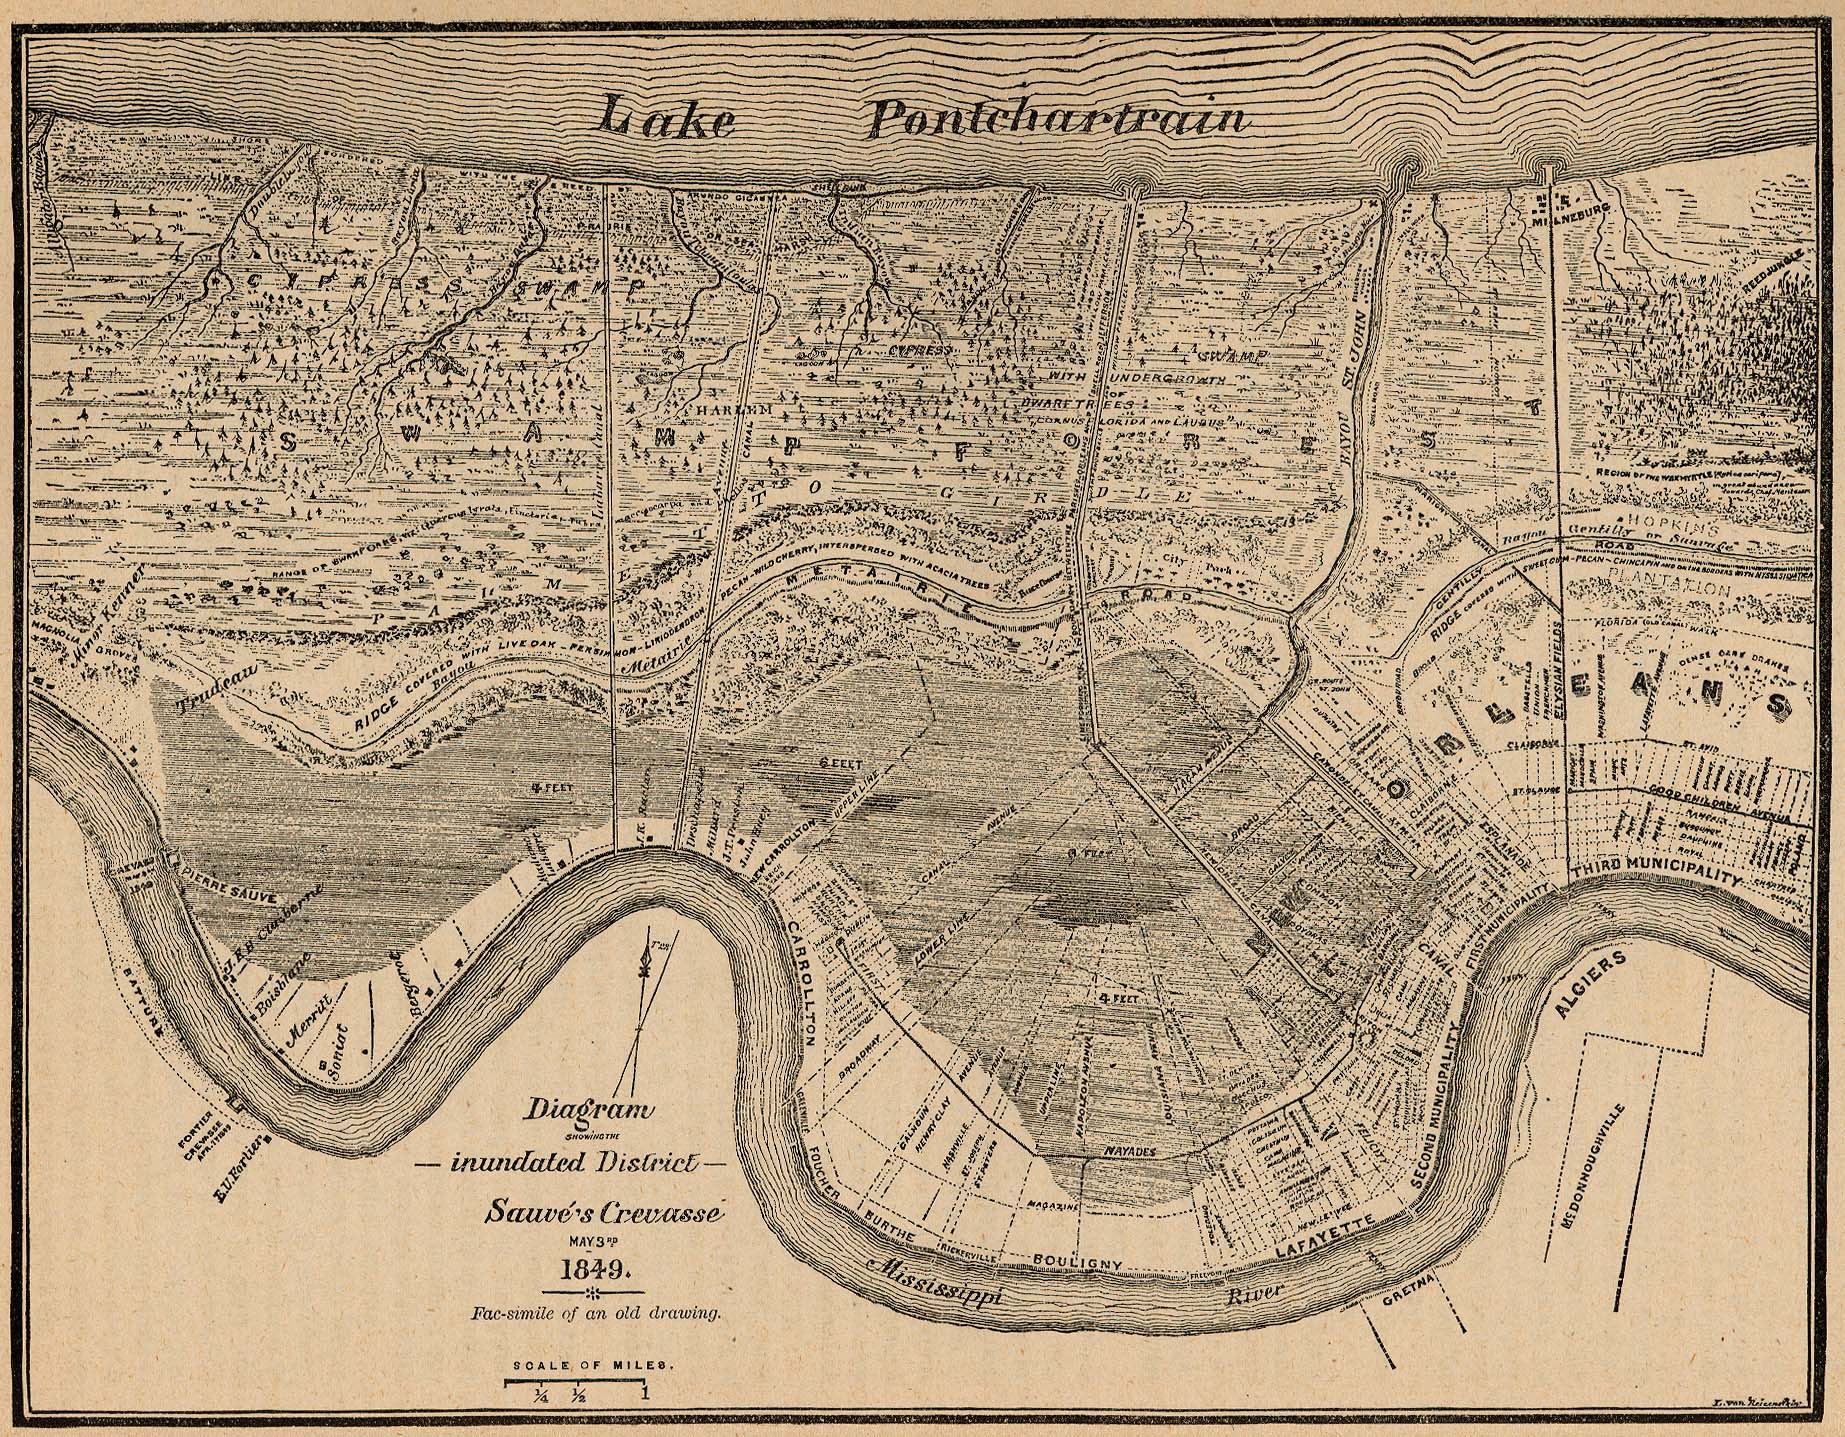
Week 9 – Flooding
Mon (Mar 12)
Blog Due
Wed (Mar 14)
NO CLASS - DR. SUNDBERG AT CONFERENCE - USE TIME TO MEET with GROUPS
Week 10 – Flooding Pt II
Mon (Mar 19)
Work on Story Maps of Katrina
Wed (Mar 21)
Present Story Maps of Katrina
Part IV - Mapping the Lived Environment
Week 11 - Participatory Mapping and Maps as Surveillance
Mon (Mar 26) - Guest Lecture - Dr. Guy McHendry - Carto and Surveillance
Wed (Mar 28)
Blog covering Carto Activity and Dr. McHendry's Lecture due before Friday at 12:30pm
Week 12 – Work Week
Mon (Apr 2)
No Class - Easter Monday
Wed (Apr 4)
Work on FINAL PROJECT
Week 13 – Work Week
Mon (Apr 9)
Work on FINAL PROJECT
Wed (Apr 11)
Work on FINAL PROJECT
Week 14 – Creating your Map
Mon (Apr 16) -
Blog Due
Wed (April 19)
Dr. Sundberg away at conference - Work on Final Projects
Week 15 – Work Week/Presentations
Mon (Apr 24) - Work Day (finishing touches)
Wed (Apr 26) - Final Presentations - Groups 1-3
Week 16 – Finals Week - Class Presentations
See Creighton Finals Schedule for Date/Time - Final Presentations - Groups 4-7
Complete Peer Reviews of Student Projects by final date of semester
ASSIGNMENTS:
Your grade will be determined based on your performance during in-class participation as well as on exams and papers. A total of 1100 points are possible in this course, distributed as follows:
Final Project - 400 pts
Blog Posts – 350 pts
Creighton Then & Now Assignment - 150
Participation – 300 pts
Final Project
The final project is worth thirty percent of the course grade and is the capstone of the course. The final project is divided into 6 stages. Students will work in teams of 3-4 people and will submit group work to the course blog.
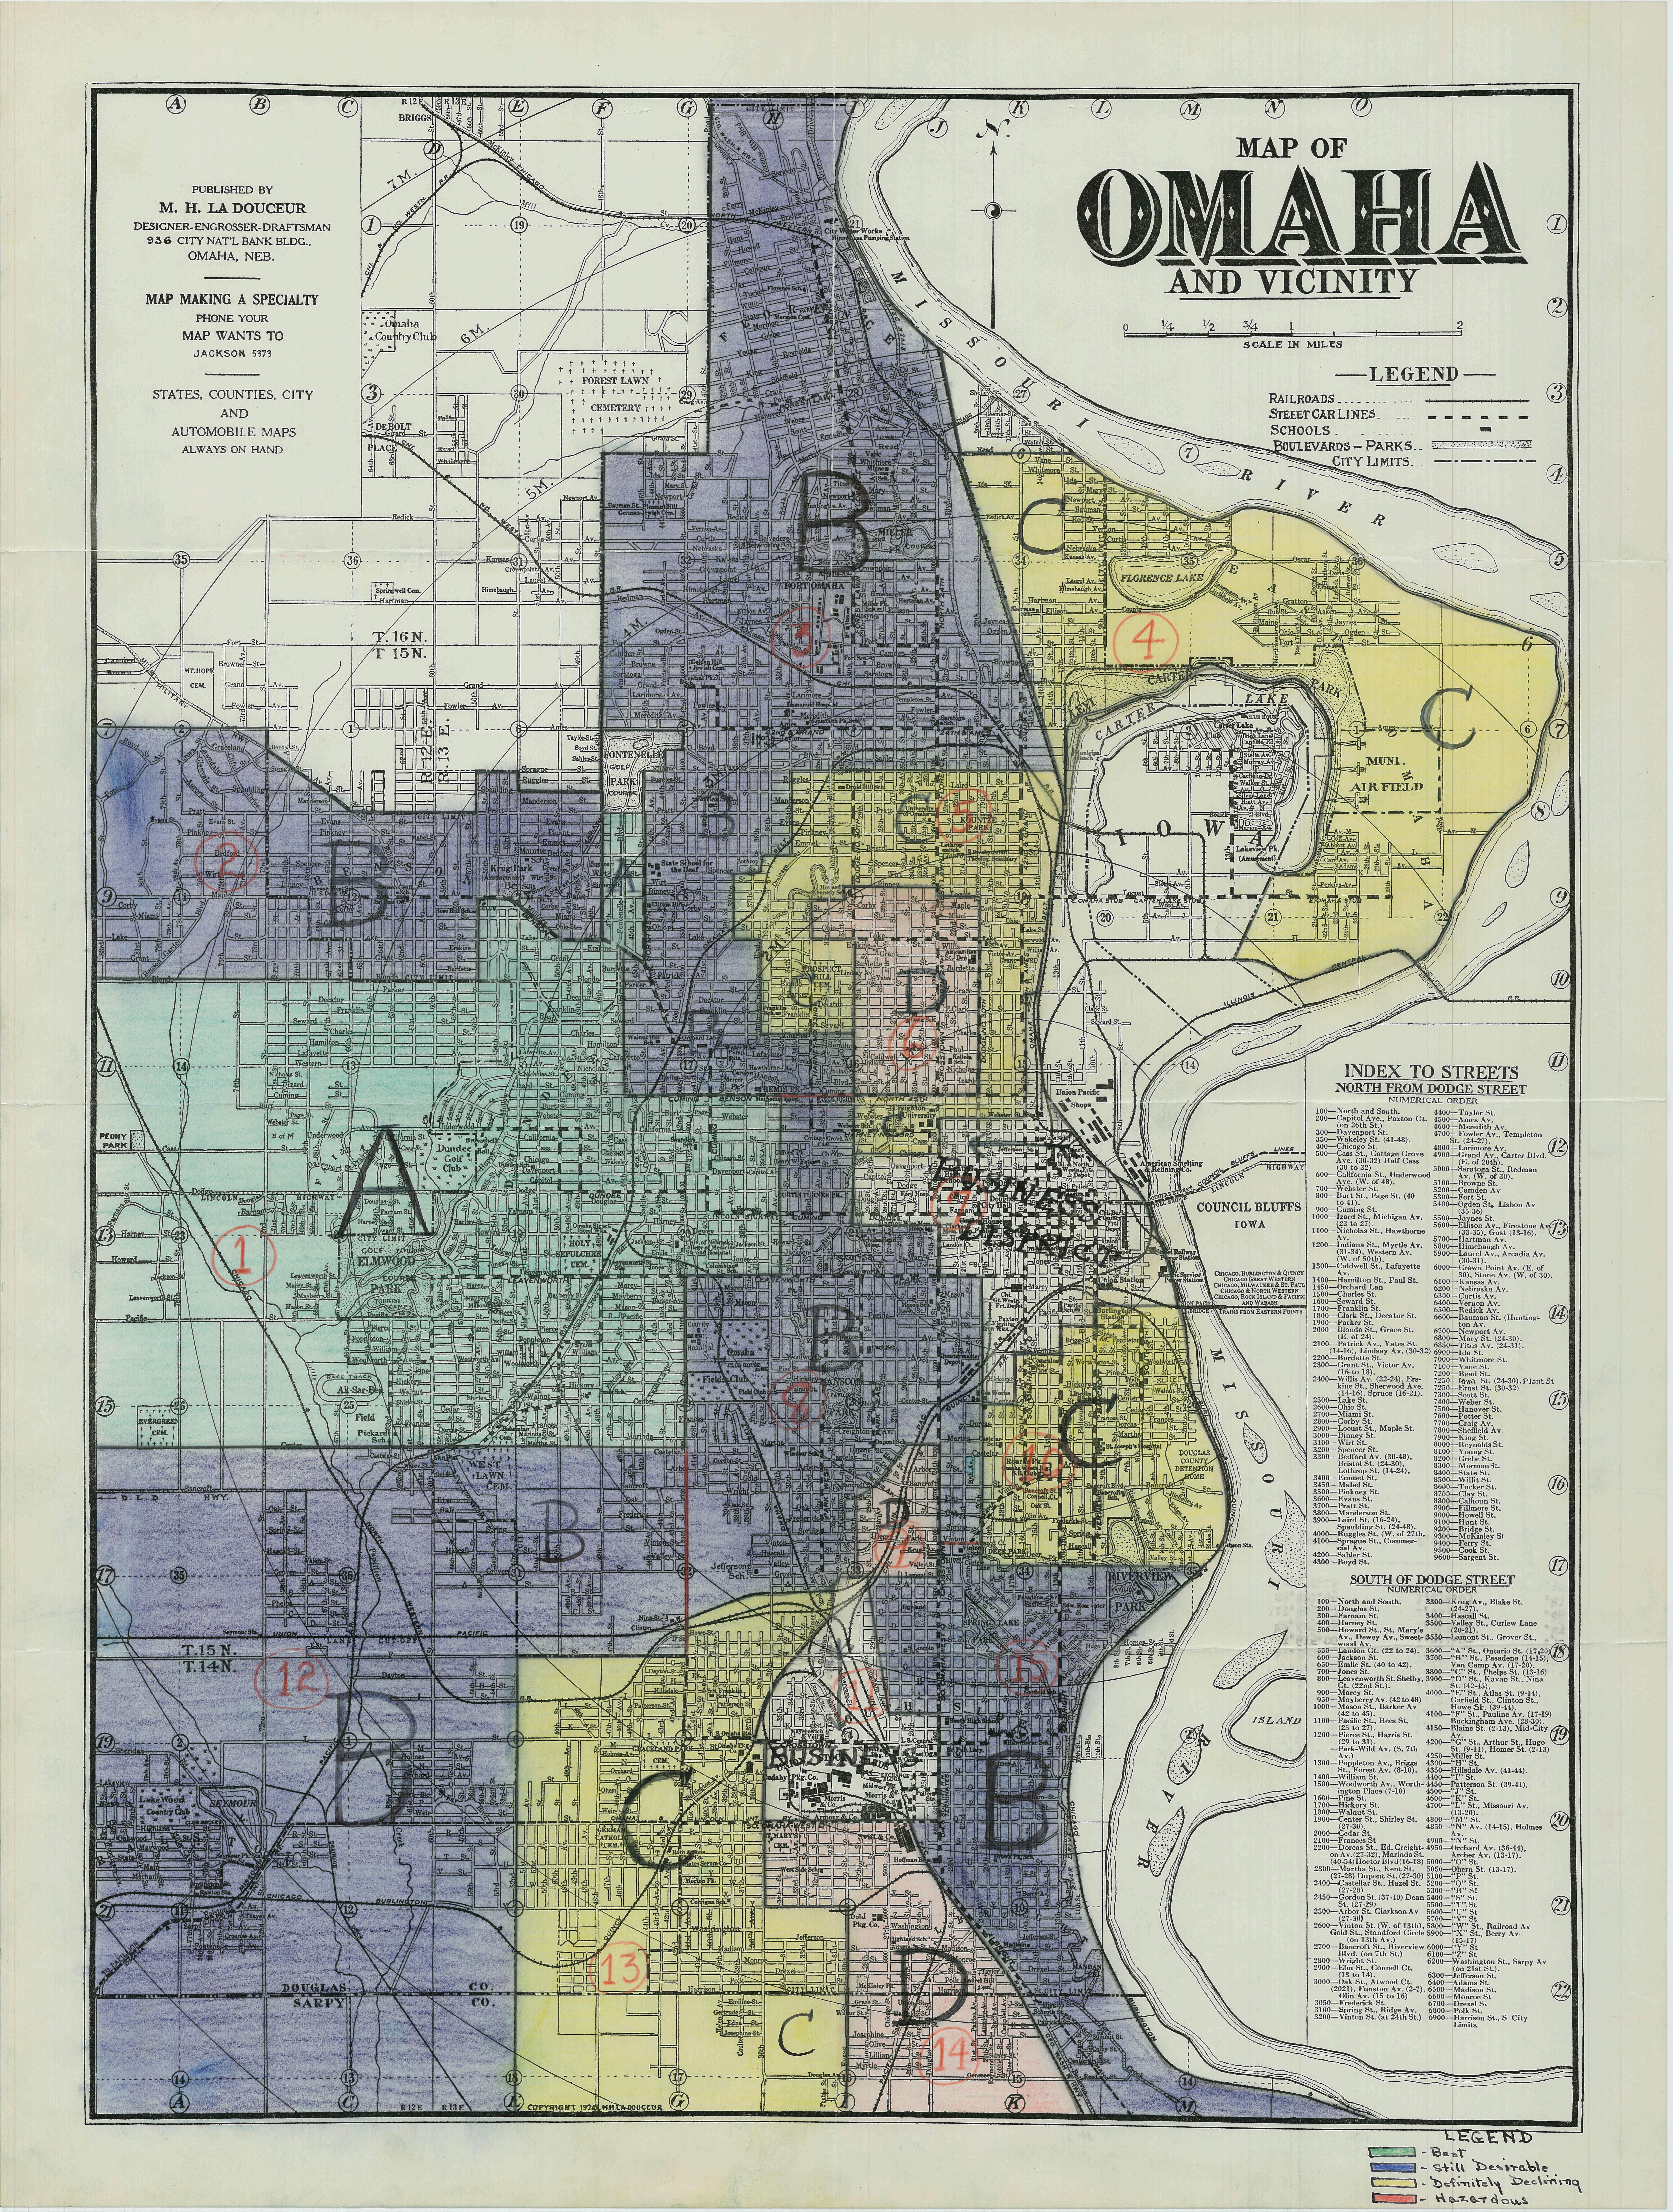
- Stage 1. Research Question – (25 pts) The first stage of the project is to choose a suitable historical question about the legacy of redlining in Omaha. You and your group will develop your question from one of the following themes: demographic change; racial violence in Omaha; streetcars and suburbanization; automobiles and highways; lead pollution in Omaha; flooding, insurance, and disasters; crime and policing; home loans and housing policy; schools & education
- Good historical questions are important because they ground good histories AND good maps. Your map needs to have a goal — a question that requires an answer. One delegate of the group will submit a jointly-written short two-paragraph response to the course blog that lays out the research question and a brief historical context. Ex. How has North Omaha's demographic makeup changed over time? Do redlining boundaries inform lead hazards? Which regions of Omaha have greatest/least access to home loans and how has that changed over time? All questions must be historical and spatial.
- Stage 2. Project Proposal – (50 pts) This one page proposal lays out 1. The scope of the project 2. Possible sources (i.e. digital maps, online data, historical data) that will be employed in a digital mapping product 3. A clear explanation of the value of this project as a piece of scholarship.
- Stage 3. Data Collection –(50 pts) students must submit an “annotated” list of 10 potential sources of data (digital or physical) as well as 10 scholarly secondary sources that inform the historical meaning of the project.
- Stage 4. "Rough Draft" (100 pts) - Each group will bring a working copy of their digital map. The maps need not be 100% complete, but students should also be prepared to explain how they plan to improve/enrich the map before the end of the semester. The more complete the map, the better feedback they will be able to receive.
- Stage 5. Presentation – (150 pts) students will present their work in class. You may use Powerpoint, Prezi, or a web mapping application. The presentation should last 20-30 minutes and cover the historical context of the project, its question, use of data, and conclusions.
- Stage 6. Criticism - (25 pts) All members of the course will conduct peer review of final mapping projects using skills and knowledge developed during the course. Student will post their criticisms online via the course blog
Course Blog:
All information (including this syllabus) will be available via the course blog. All readings, responses, and assignments will be posted to this course blog as well. Students are expected to read the weekly assignment, critique the map(s), and post their responses to the blog every Monday prior to class. Responses can integrate readings from previous weeks and are required to include perspectives from the current week. The core of the response should focus on the primary source material, especially the weekly map(s). Practicum exercises will also be posted to the blog. The blog is a living document that shows the development of the course and student projects. Blogging is a flexible format that facilitates a wide range of media and students are encouraged to integrate visual and digital sources into their assigned responses and projects. Students are expected to treat writing assignments as professional development and all standards of academic writing will apply in the blog post as well.
Participation:
The participation grade applies to in-class discussion of the readings and maps and the practicums. All readings must be completed by the assigned date on the syllabus (Mondays, unless otherwise stated). All practicums must be completed by the end of the course. A sizable percentage of the final grade will depends on the frequency and quality of your comments in class. This requires reading the material and formulating ideas and opinions before your arrive at class.
Grading Scale:
- A: 90-100
- B+: 85-89
- B: 80-84
- C+: 75-79
- C: 70-74
- D+: 65-69
- D: 60-64
- F: 59 and below
LATE PENALTIES:
Assignments will be deducted 1/2 of a letter grade for each 24-hour period they are late.
ATTENDANCE:
Education demands your active involvement, therefore daily attendance is required. I will keep track of attendance at the beginning of every class period. One absence will be excused per student, regardless of reason. For every subsequent absence, students will have 22 points (out of 1,100 = 2%) deducted from their final grade . Exceptions to this rule will be very limited and only granted in circumstances left up to the discretion of the instructor.
PLAGIARISM & ACADEMIC MISCONDUCT:
Academic misconduct will not be tolerated. This includes plagiarism. Do not attempt to use others works without proper citation. Acknowledge the source material for all of your work. In the event of plagiarism, the student will receive zero points for the assignment. While plagiarism is the most common form of academic misconduct, it also extends to the disruption of class, threatening behavior, cheating or misrepresentation.
DISABILITIES:
If you have a disability for which you need an accommodation, you are encouraged to contact both your instructor and the Office of Disability Accommodations located in the Old Gym, Room 408 (402-280-2166) as early as possible in the semester.
WEATHER CANCELLATION:
In the event that inclement weather forces the university to close, the course schedule will be adapted at the discretion of the instructor. All changes to the syllabus (and notice of class cancellations) will come via BlueLine.
WRITING HELP:
Good writing is a skill that requires practice, but also guidance. Peer-review is acceptable as long as the authors create products that are demonstrably their own work. (see plagiarism and academic misconduct above). Also, feel free to stop by my office hours if you would like help. The Creighton Writing Center is the best option and an underutilized resource. You can schedule appointments at the Writing Center in Creighton Hall 136.
Credits:
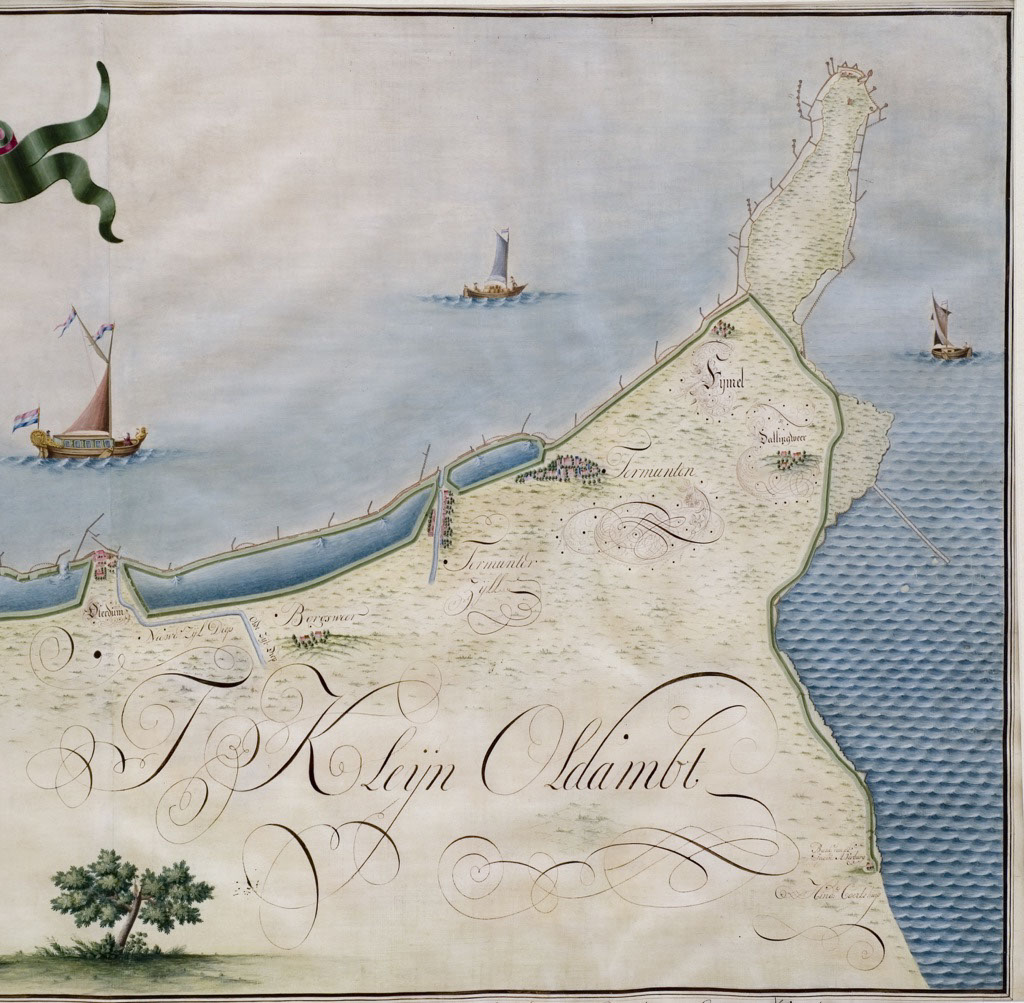
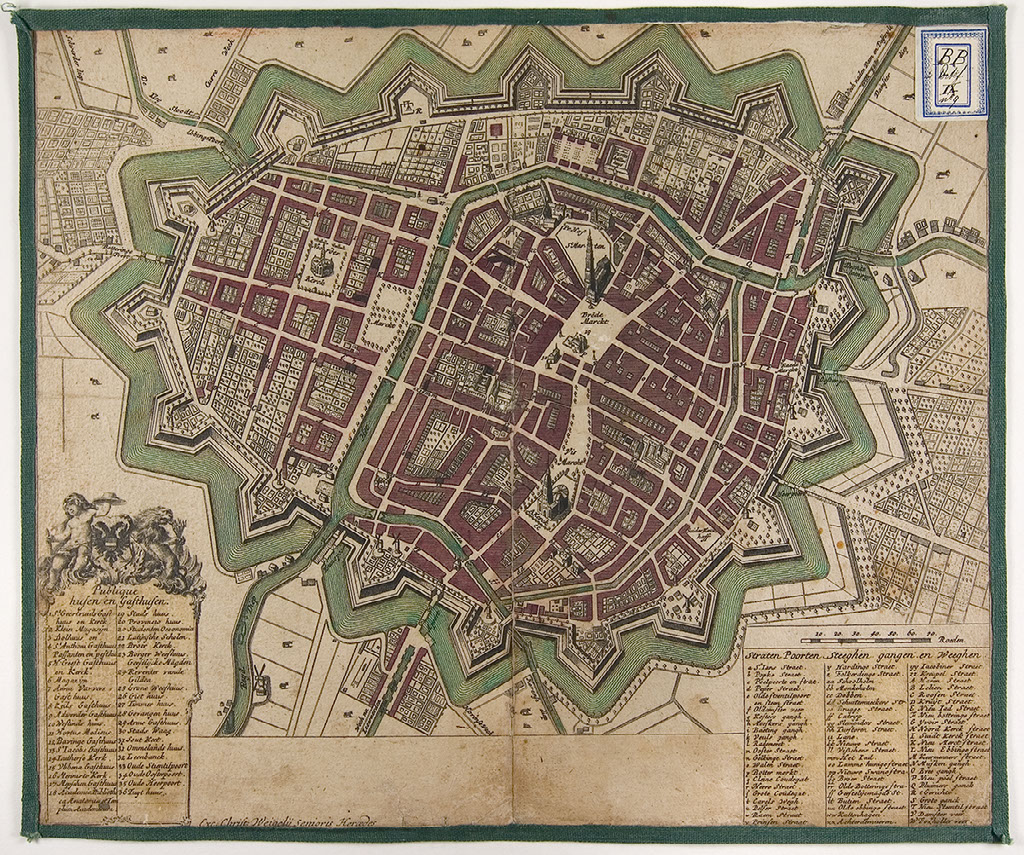
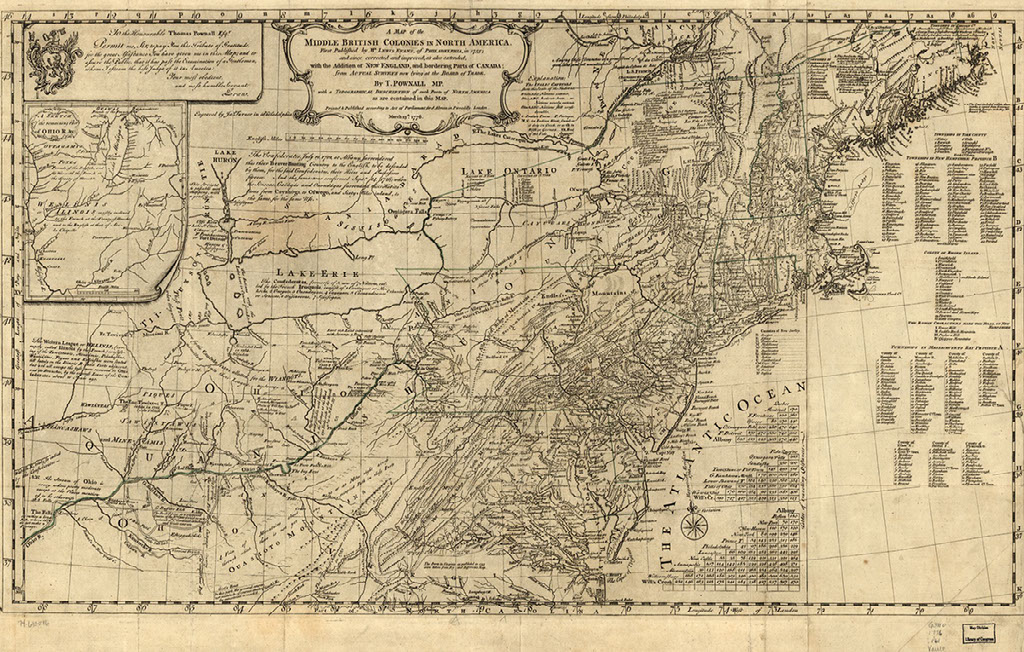
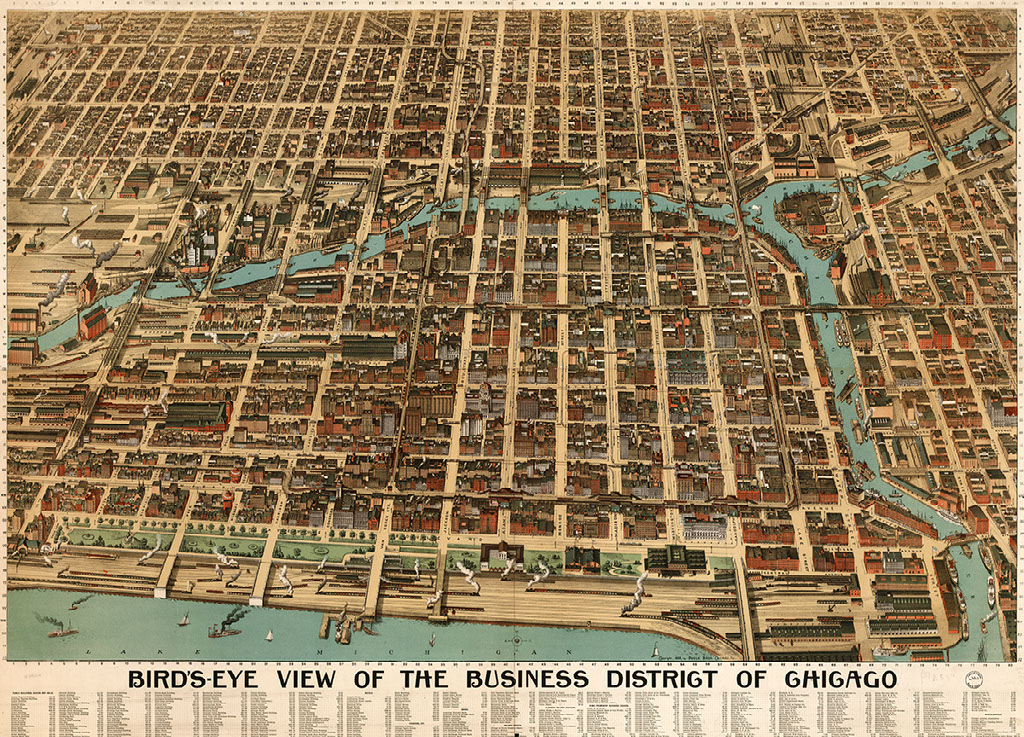
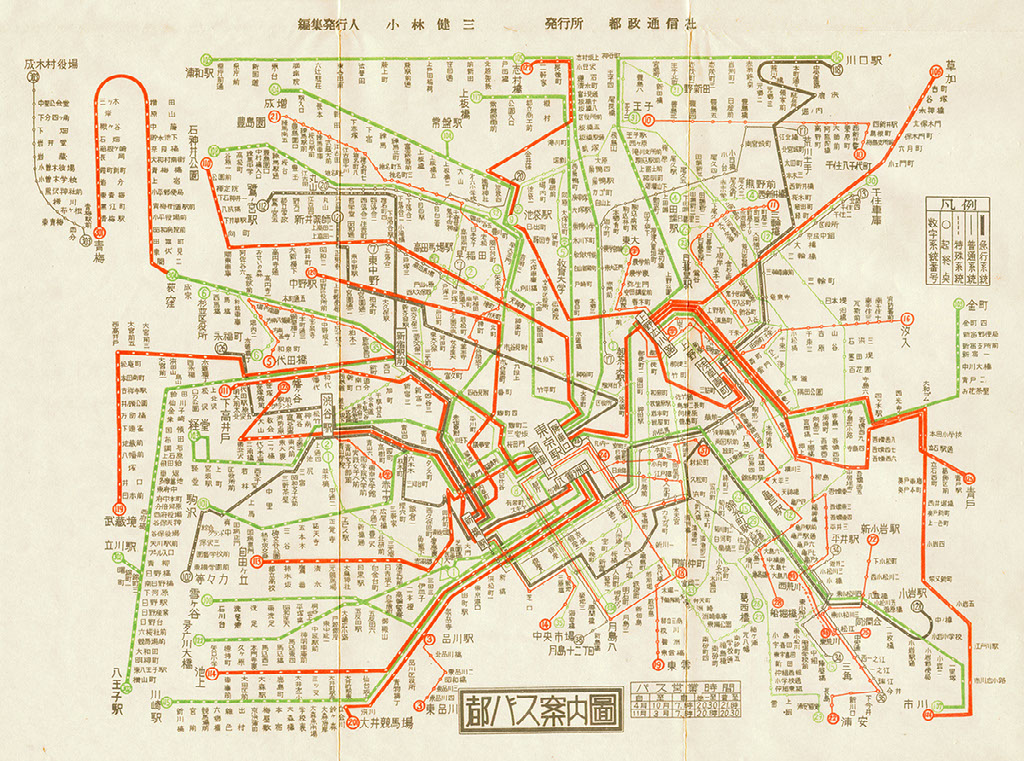
[Plattegrond van Groningen], 1700. http://irs.ub.rug.nl/ppn/11002236X Lewis Evans, A general map of the middle British colonies in America, 1755. https://www.loc.gov/item/74693076/ Alexander von Humboldt, Geography of Plants, 1805. https://upload.wikimedia.org/wikipedia/commons/7/7e/Zentralbibliothek_Z%C3%BCrich_-_Ideen_zu_einer_Geographie_der_Pflanzen_nebst_einem_Naturgem%C3%A4lde_der_Tropenl%C3%A4nder_-_000012142.jpg Johann Baptiste Homann, Geographische Vorstellung der jämmerlichen WASSER-FLUTT in NIEDERTEUTSCHLAND, welche den 25.Dec. Ao. 1717, in der heiligen Christ-Nacht, mit unzählichen Schaden und Verlust vieler tausend Menschen einen großen theil derer Hertzogth. HOLSTEIN und BREMEN, die Grafsch. OLDENBURG, FRISLANDT, GRÖNINGEN und NORT-HOLLAND überschwemmet hat. https://upload.wikimedia.org/wikipedia/commons/6/6d/Weihnachtsflut61.jpg Muhammad Al-Idrisi, Tabula Rogeriana, 1154. https://upload.wikimedia.org/wikipedia/commons/a/a1/TabulaRogeriana_upside-down.jpg Bird's-eye-view of the business district of Chicago, 1898. https://www.loc.gov/item/75693212/ Tokyo Bus Map, c. 1950. http://www.oldtokyo.com/wp-content/uploads/2015/02/tokyo-bus-map.jpg Gerard Mercator, Septentrionalium Terrarum description, 1606. https://upload.wikimedia.org/wikipedia/commons/9/92/1606_Mercator_Hondius_Map_of_the_Arctic_%28First_Map_of_the_North_Pole%29_-_Geographicus_-_NorthPole-mercator-1606.jpg